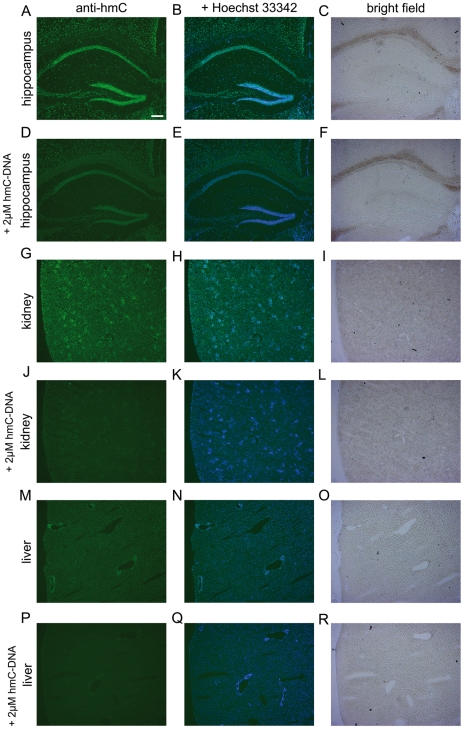
Figure 5. Immunolocalization of hmC in mouse hippocampus, kidney, and liver.
Scale bar: 200 µM. Left column: mouse tissues stained with anti-hmC (green). Middle column: mouse tissues stained with anti-hmC (green) and Hoechst 33342 (blue) for nuclear staining. Right column: Bright field pictures of corresponding tissue. In every second row 2 µM hmC-DNA were added to compete the anti-hmC staining signal out.

