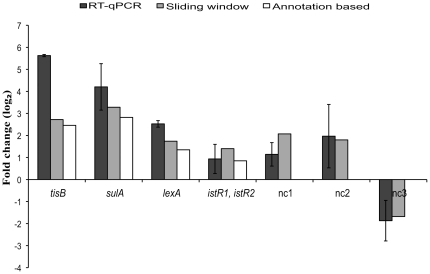
Figure 5. RT-qPCR validation results compared to array data.
The fold change (log2) of the RT-qPCR validation along with the array expression data for a chosen set of differentially expressed genes and novel gene candidates. The standard errors of quadruplicate parallel RT-qPCR experiments are shown and the solid bars represent the mean of the quadruplicates. All transcript levels were measured relative to rrsB which was assumed to have a constant expression level. The genes examined lexA, tisA/B and sulA are in essence positive controls as they are well documented as being upregulated following irradiated with UV light. The fold change values assume a maximum PCR efficiency of two. The details of nc1-nc3 can be found at GEO (GSE13829).

