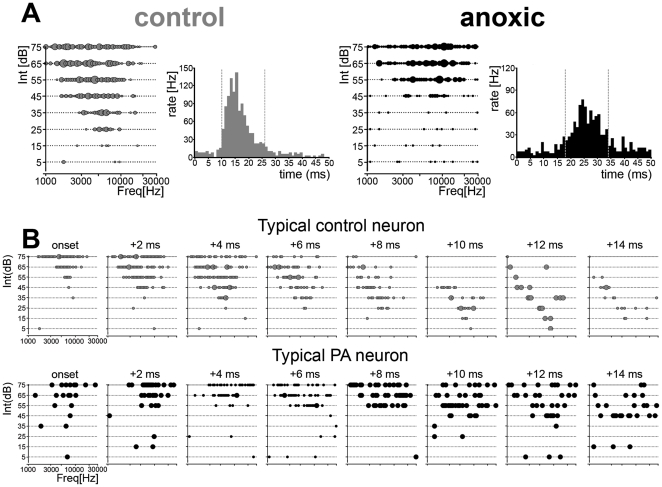
Figure 3. Tuning curves temporal dynamics.
(A) Representative tuning curve examples obtained from one control (left) and one PA rat (right); PSTHs for those neurons are shown at the right of each example. Dashed lines mark the time windows selected for reconstructing response tuning dynamics based on a 2 ms bin. Note that response onset latency was increased in the sample PA neurons, while response strengths were reduced. (B) Temporal sequences of instantaneous tuning for single neurons recorded from one control (top) and one anoxic (bottom) rat. High-intensity tones corresponded to shorter latencies responses contributing to the PSTH's earlier phase; lower intensity tones corresponded to increasingly longer latency responses, contributing to the later phase of the PSTH. Time-slice per panel is 2 ms.

