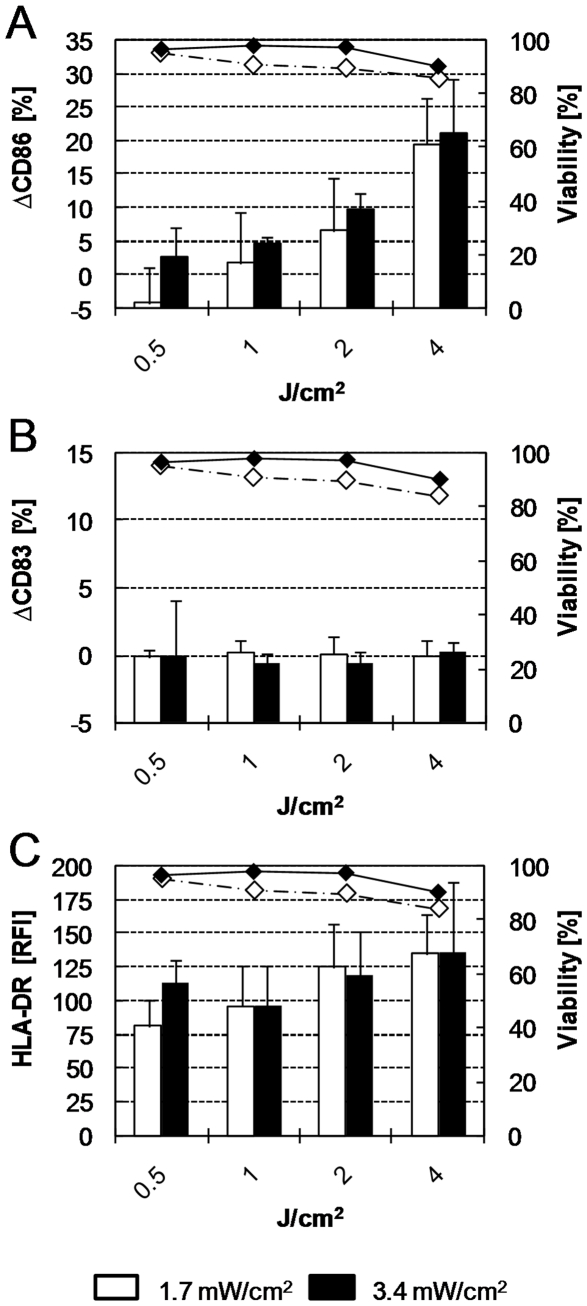
Figure 1. Effects of UVA radiation on the expression of CD86, CD83, HLA-DR and viability of PBMDCs.
Cells were exposed to the indicated UVA doses (X axis) with intensities of 1.7 mW/cm2 (open columns) and 3.4 mW/cm2 (black columns). The expression of CD86 (A), CD83 (B), HLA-DR (C) was analyzed by flow cytometry 48 h later. The corresponding cell viability (right Y axis) is indicated for radiation intensities of 1.7 mW/cm2 (open diamonds, dashed line) and 3.4 mW/cm2 (black diamonds, solid line). Mean values ± standard deviation of at least 5 independent donors are indicated. RFI: Relative fluorescence intensity.

