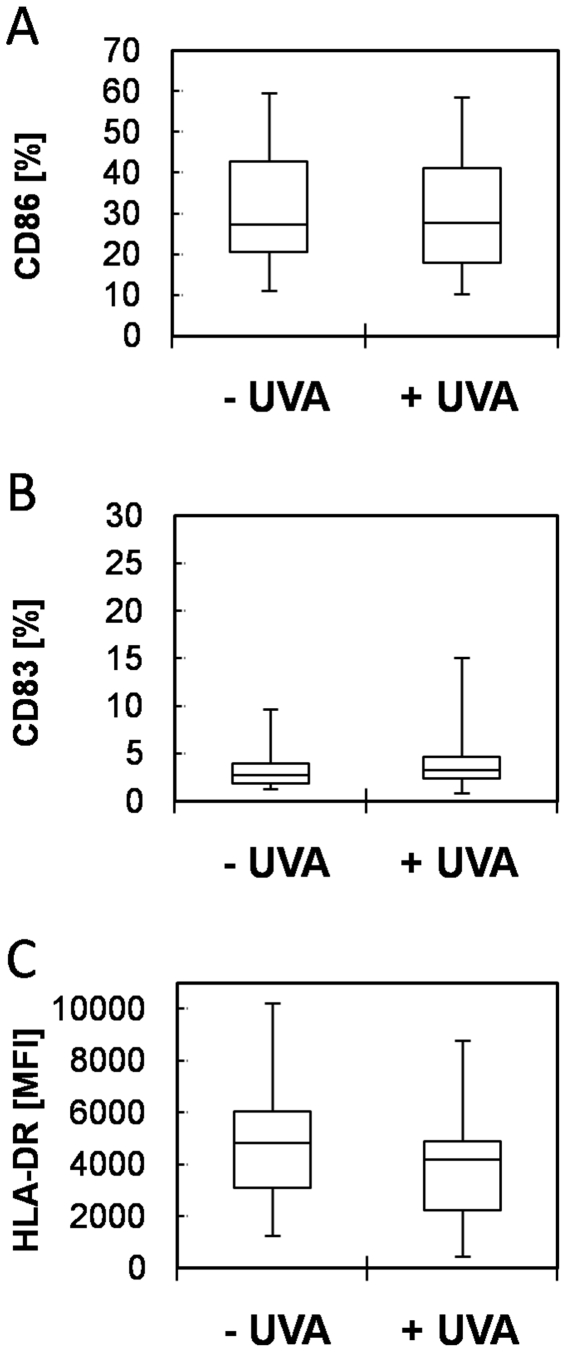
Figure 2. CD86, CD83 and HLA-DR expression of PBMCDs irradiated with 1 J/cm2 UVA.
The expression of CD86 (A), CD83 (B), HLA-DR (C) was analyzed by flow cytometry on non-irradiated (- UVA) or irradiated (1 J/cm2 UVA with 3.4 mW/cm2) PBMDCs. Box plots indicate median (horizontal line), 1st, 3rd quartile (box) and maxima/minima-values (T-bars) of at least 40 independent donors. MFI: Mean fluorescence intensity.

