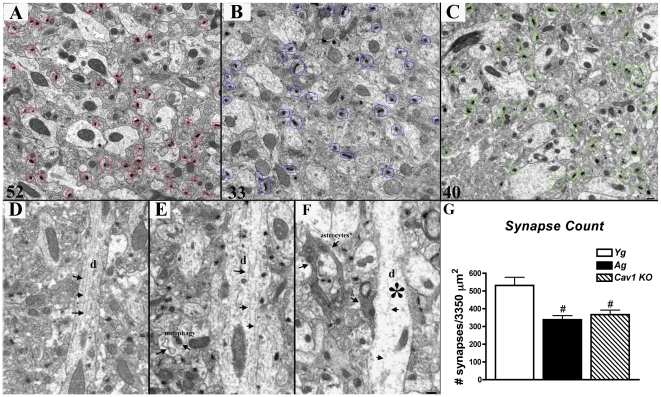
Figure 6. Cav-1 KO mice have reduced hippocampal synapses.
Synapses were quantified by routine electron microscopy as previously described [82]. EM analysis revealed a significant reduction in hippocampal synapses in both (C) Cav-1 KO (Yg) and (B) Ag mice compared to (A) WT. Synapses are indicated by red circles in WT, blue circles in Ag, and green circles in Cav-1 KO. (D) WT micrographs exhibited dendritic processes (indicated by d) with intact cytoskeletal architecture (arrows and arrowheads), while (E) Ag and (F) Cav-1 KO displayed less organized dendritic shafts (asterisk) with more abundant astrocyte presence (arrows). (G) Quantitation of data.

