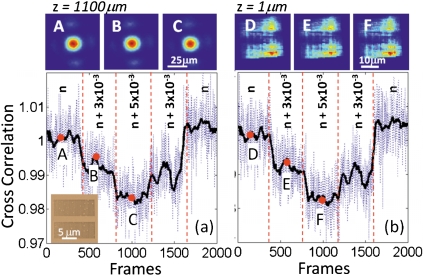
Figure 2.
Cross correlation coefficients are calculated between the first lensfree transmission pattern and the subsequent patterns for (a) the detector plane (z=1100 μm) and (b) z=1 μm reconstruction plane, as illustrated with the blue dotted lines. The same plots also show the running averages of these cross correlation coefficients over ∼50 frames as shown with the black solid lines in (a) and (b). The intensities of the lensfree transmission patterns used in (a) and (b) are normalized to the instantaneous illumination intensity, which is also detected using the same CMOS chip through a large aperture. The initial refractive index of these sensing experiments (n) is 1.333 corresponding to DI water. Top row: (a)–(c) illustrate the raw lensfree diffraction patterns of the nanoaperture array at three different refractive indices within the microfluidic channel (n, n+3×10⁻³, and n+5×10⁻³, respectively), where all the lensfree transmission patterns extend over a width of >50 μm. Top row (d)–(f) illustrate the reconstructed transmission patterns of the same nanoaperture array at z=∼1 μm plane, right underneath the aperture region.

