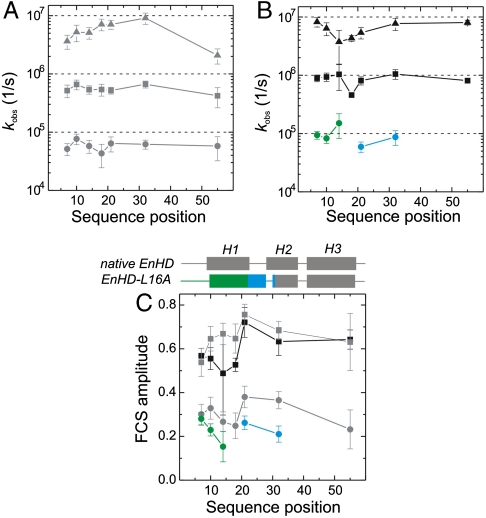
Fig. 2.
Sequence position-specific kinetics of protein chain motions. (A) Observed rate constants of folding (I-N, circles), of formation of the intermediate (U-I, squares), and of loop closure within the unfolded state (U, triangles) from PET-FCS data at high ionic strength (gray), plotted as function of sequence position. (B) Observed rate constants at low ionic strength (black) plotted as function of sequence position. Triangles and squares represent kinetics within U and of U-I, as shown in A. Green and blue circles reflect kinetics of helix1 motions within the intermediate and local refolding, respectively. (C) Observed amplitudes of FCS decays. Helical secondary structure in the sequence of native EnHD and its folding intermediate is illustrated on the top of the panel. Symbols and color code are the same as in A and B. All error bars are standard errors from data fits.

