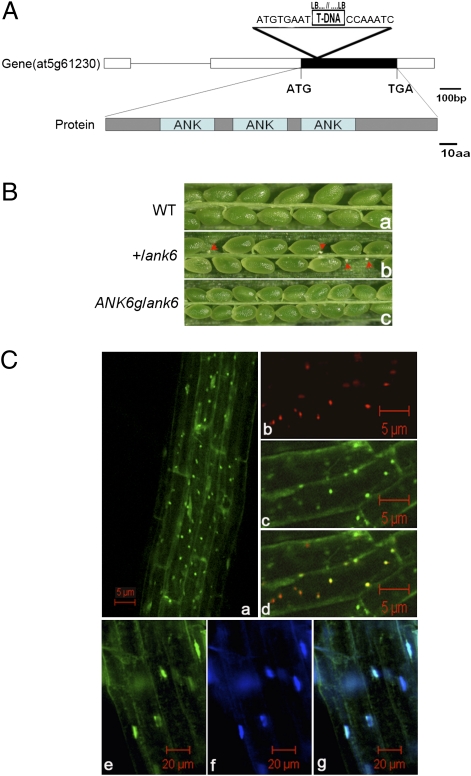
Fig. 2.
Phenotypic analysis of ank6 and subcellular localization of ANK6 protein. (A) ANK6 gene organization, protein structure, and position of T-DNA insert. The ATG start codon and TGA stop codon are indicated. A T-DNA insertion (triangle above the gene diagram) was detected in the exon by PCR and DNA sequencing of the PCR-amplified products. (B) In contrast to WT (B, a), a silique of self-pollinated +/ank6 plants showed unfertilized ovules (B, b; arrowheads), whereas a silique of complemented transgenic plants showed the WT phenotype (B, c). (C) ANK6-GFP protein (green) is localized both in mitochondria (C, d) and nuclei (C, g) using organelle-specific dyes as markers. Overview of GFP signals (C, a), mitochondria stained with the MitoTracker (red) (C, b), ANK6-GFP (green) (C, c), merged image of C, b and C, c (yellow) (C, d), nuclei stained with nuclear DNA-specific dye Hoechst 33258 (blue) (C, f), ANK6-GFP (green) (C, e), and merged image of C, e and C, f (C, g).

