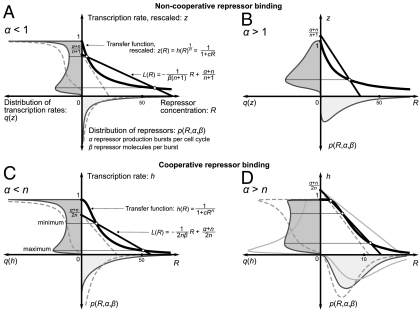
Fig. 2.
Geometric construction of the conditions for bimodal distribution of transcription rates q(h) in systems with noncooperative (A and B) and cooperative (C and D) binding of n repressors. The extrema of q(h) are the points of intersection of the rescaled transfer function z(R) (Eq. 5) and the straight line L(R) (Eq. 6) (noncooperative case), or the transfer function h(R) (Eq. 3) and the straight line L(R) (Eq. 8) (cooperative case). A and B show the simplest case of noncooperativity, with n = 1 and z(R) = h(R). The height at which L(R) intersects the vertical axis depends on the number α of repressor production bursts per cell cycle. The slope of L(R) depends on the number β of repressor molecules produced per burst. The dashed and gray solid lines show examples without intersections, which generate monomodal distributions. (A) Noncooperative binding. For α < 1, a maximum at h = 1 exists, independent of the intersections, and another maximum emerges at the lower point of intersection. (B) Noncooperative binding. For α > 1, there is always one intersection, defining the only maximum, and thus bimodality is impossible. (C) Cooperative binding. For α < n, a maximum at h = 1 exists, independent of the intersections, and another maximum emerges at the lower point of intersection. (D) Cooperative binding. For α > n, all extrema are defined by the intersections. Two maxima can emerge only when L(R) intersects h(R) three times. Parameters used for A: n = 1, c = 0.1, α = 0.5, β1 = 50 (solid line), and β2 = 15 (dashed line). Parameters used for B: n = 1, c = 0.1, β = 15, and α = 1.2. Parameters used for C: n = 2, c = 0.005, α = 0.9, β1 = 20 (solid line), and β2 = 10 (dashed line). Parameters used for D: n = 3, c = 0.0025, α = 4, β1 = 2 (black solid line), β2 = 1.6 (dashed line), and β3 = 2.7 (gray solid line).

