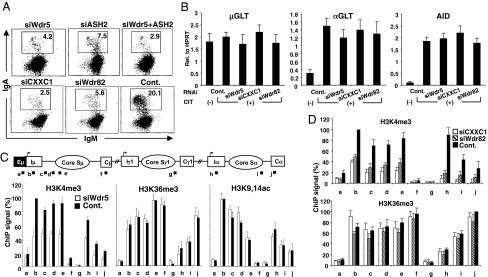
Fig. 4.
H3K4me3 is critical for CSR. (A) Profile of the IgA switching population as determined by FACS in CH12F3-2A cells following the introduction of the indicated RNAi oligonucleotide. (B) Quantification of GLTs and AID transcripts by real-time PCR derived from the RNA of the indicated RNAi oligonucleotide samples normalized to HPRT. SD values were determined from three independent experiments. (C and D) (Top) Schematic diagram of the position of PCR products for the ChIP assay. The ChIP assay was performed in various knockdown and control samples using the indicated antibodies. Background values from controls with no antibody were subtracted (generally <5% of the antibody signal). Values were normalized to the DNA input signals followed by the maximum value in each data set. SD values were derived from three independent experiments.

