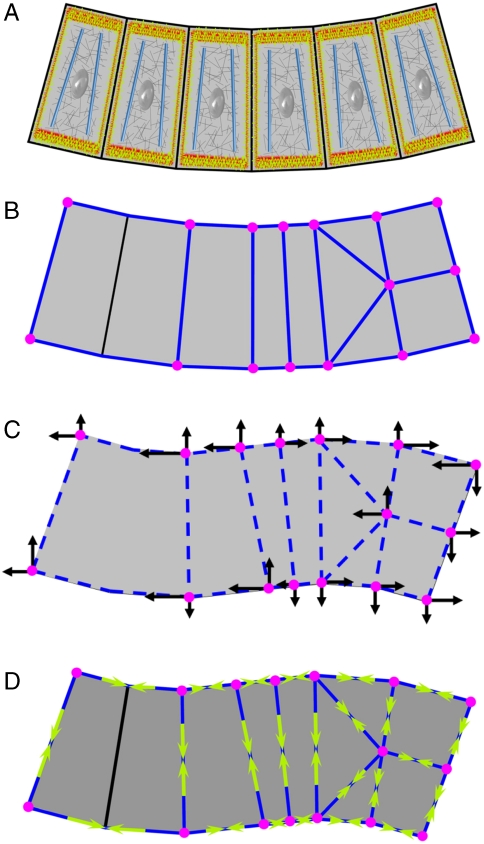
Fig. 1.
An illustration of the VFM method. A shows a cross-section through a generic epithelium. Active components in the cells are shown in color and passive ones in gray. (B) A polygonal partitioning of the epithelium at time t. (C) At time t + Δt, the example epithelium has adopted a new, deformed geometry. To deform the passive cellular components from geometry (B to C), the forces shown as black arrows must be applied at the registration points (magenta) for duration Δt. These forces are computed using a finite element procedure (24). (D) VFM calculates the edge forces (yellow arrows) and intracellular pressures (not shown) that must act in concert to produce the set of forces shown in C.

