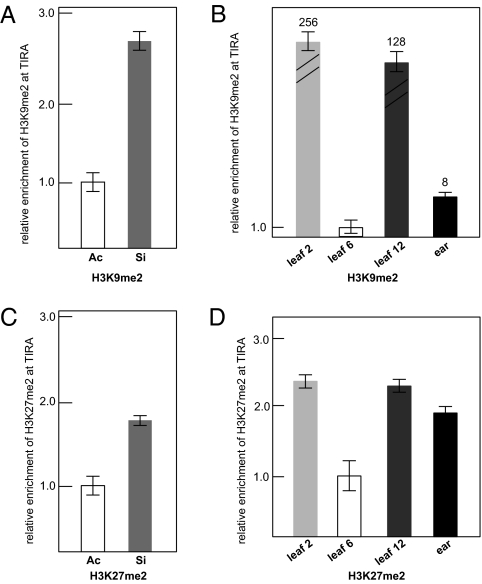
Fig. 2.
ChIP analysis of enrichment of histone marks at TIRA. (A) Relative enrichment of H3K9me2 in leaf 6 of stably silenced MuDR compared with an active MuDR element as determined by quantitative PCR. ChIP results were normalized to copia and then to the value of active MuDR. (B) Quantitative PCR analysis of relative enrichment of H3K9 dimethylation at TIRA in different tissues of F1 plants. ChIP results were normalized first to copia and then to the value of active MuDR. (C) Quantitative PCR analysis of H3K27 dimethylation in TIRA of active and stably silenced MuDR elements in young leaf 6. (D) Quantitative PCR of relative enrichment of H3K27 dimethylation in TIRA of various tissues of F1 plants. The value for leaf 6 was arbitrarily set at 1.

