Fig. 3.
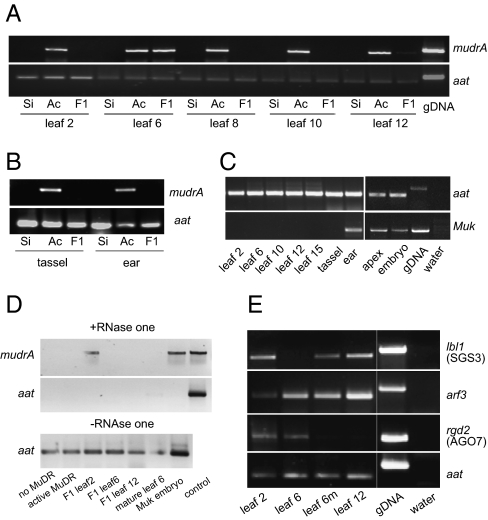
Analysis of tissue-specific changes in gene expression. (A) RT-PCR analysis of mRNA levels of mudrA in different leaves of plants carrying silenced (Si), active (Ac), and F1 MuDR elements. (B) RT-PCR analysis of mRNA levels of mudrA in the tassel and ear of plants carrying silenced, active, and F1 MuDR elements. (C) RT-PCR analysis of Muk in various tissues. (D) RT-PCR detection of dsRNA in various tissues of F1 plants. (E) RT-PCR analysis of maize homologs of SGS3 (lbl1), ARF3, and AGO7 (rgd2) in different leaves of F1 plants. Leaf 6m represents a mature and fully expanded leaf 6; all other leaves were developing young leaves. gDNA, genomic DNA.

