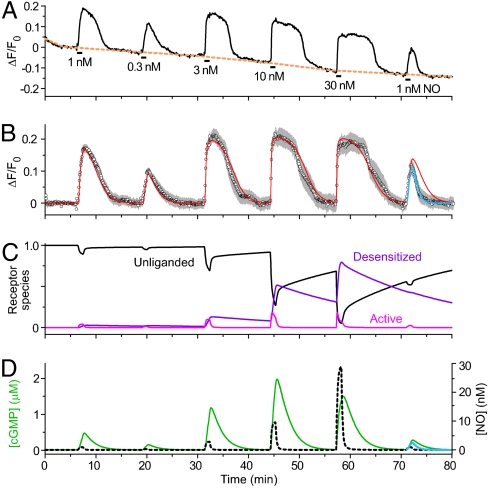
Fig. 1.
Behavior of GClowPDEHEK cells in response to perfusion (1 min) of different clamped NO concentrations. (A) Responses of a single cell, illustrating how baselining was applied (orange broken line); the mean population responses (seven cells) are shown in B. The red line fits the data to the GC/PDEHEK model (Fig. 2 and SI Materials and Methods) with GCmax = 0.235 μM/s and PDEmax = 0.036 μM/s; for the final response, PDEmax was raised to 0.08 μM/s to fit the faster decay (blue line). The changes in the principal NO receptor species during the course of the experiment, according to the model, are shown in C; with reference to Fig. 2A, Unliganded, GC; Active, NOGC*; and Desensitized, GC*NO. (D) Predicted changes in cGMP concentration giving rise to the fluorescent changes depicted in B, together with the profiles of applied NO concentration (calibrated from the kinetics of fluorescein wash-in and wash-out; see SI Materials and Methods).

