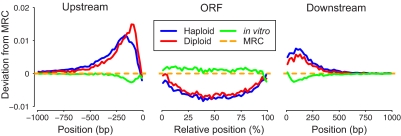
Fig. 3.
Target site distribution in the neighborhood of all yeast ORFs. In haploid (blue line), diploid (red line), and in vitro (green line) datasets, the insertion site frequency is represented as a deviation from the MRC (yellow dotted line). Data upstream and downstream of each gene are presented as positions relative to the transcription start site or transcription termination site. Insertions are plotted in percentage intervals along the gene.

