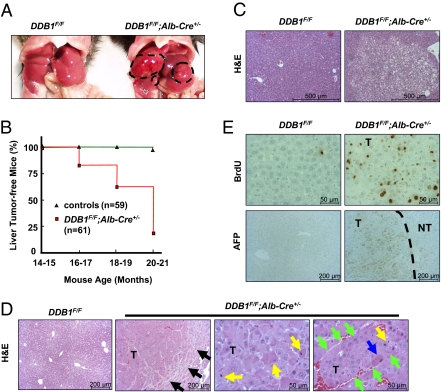
Fig. 4.
Aged DDB1F/F;Alb-Cre+/− mice developed HCC. (A) Representative photograph of liver tumors (outlined with dashed white lines) in a 19-mo-old DDB1F/F;Alb-Cre+/− mouse. (B) Age-dependent increase of liver tumor incidence in DDB1F/F;Alb-Cre+/− mice. Each age group has at least 10 animals of each genotype. n, total number of mice. (C) H&E staining of premalignant nodules shows clear cell dysplasia in a 15-mo-old DDB1F/F;Alb-Cre+/− mice. (D) Histological analysis of the liver tumor (T). Black arrows indicate the tumor edge, yellow arrows mitotic figures, blue arrows apoptotic cells, and green arrows rims of a trabecular growth of multiple layers of malignant cancer cells. (E) IHC analysis of the tumor. AFP, α-fetoprotein. Dashed line separates nontumor (NT) from tumor part.

