Figure 2.
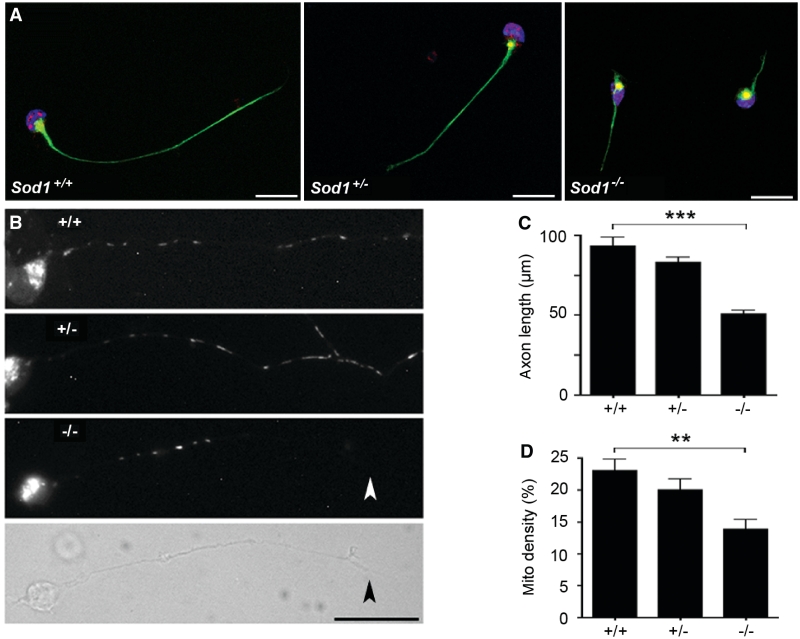
Sod1−/− primary motor neurons show reduced axon outgrowth and decreased mitochondrial density. (A) Sod1+/+, Sod1+/− and Sod1−/− primary motor neurons at 24 h in culture, labelled with phosphorylated neurofilament antibody (NF160, green), Hb9 antibody (red) and DAPI (blue). Scale bar = 20 µm. (B) Motor neurons labelled with Mitotracker Red CM-H2XRos (24 h in culture). A phase contrast image is shown for the Sod1−/− motor neuron to visualize the full-length of the axon (the terminal is marked with an arrowhead). Scale bar = 25 µm. (C) Axon length at 24 h. The 500–600 neurons per group were measured. Mean ± SEM from n = 4 replicates is shown (***P < 0.001; ANOVA with Tukey post hoc test). (D) Mitochondrial density expressed as percentage of axon length occupied by mitochondria. Twenty-five axons per group were analysed. Mean ± SEM from n = 3 replicates is shown (**P < 0.01; ANOVA with Tukey post hoc test).

