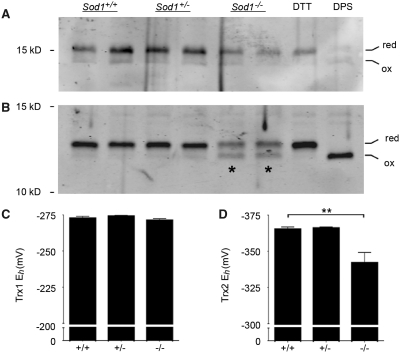
Figure 3.
Sod1−/− neurons show preferential oxidation of mitochondrial versus cytosolic thioredoxin. (A) Thioredoxin-1 (cytosolic) redox western. (B) Thioredoxin-2 (mitochondrial) redox western. Asterisks indicate the increased density of the oxidized band in Sod1−/− samples. Dithiothreitol (DTT)- and dipyridyldisulfide (DPS)-treated cells were included to verify position of reduced and oxidized bands, respectively. (C) Thioredoxin-1 (Trx1) redox potentials (derived using the Nernst equation) show no difference between Sod1−/− and controls. (D) Thioredoxin-2 (Trx2) shows a +23 mV shift in Sod1−/− neurons, toward a more oxidized redox potential. Mean ± SEM is shown for n = 3–6 replicates per group (**P < 0.01; ANOVA with Tukey post hoc test). The y-axes are inverted for ease of interpretation.

