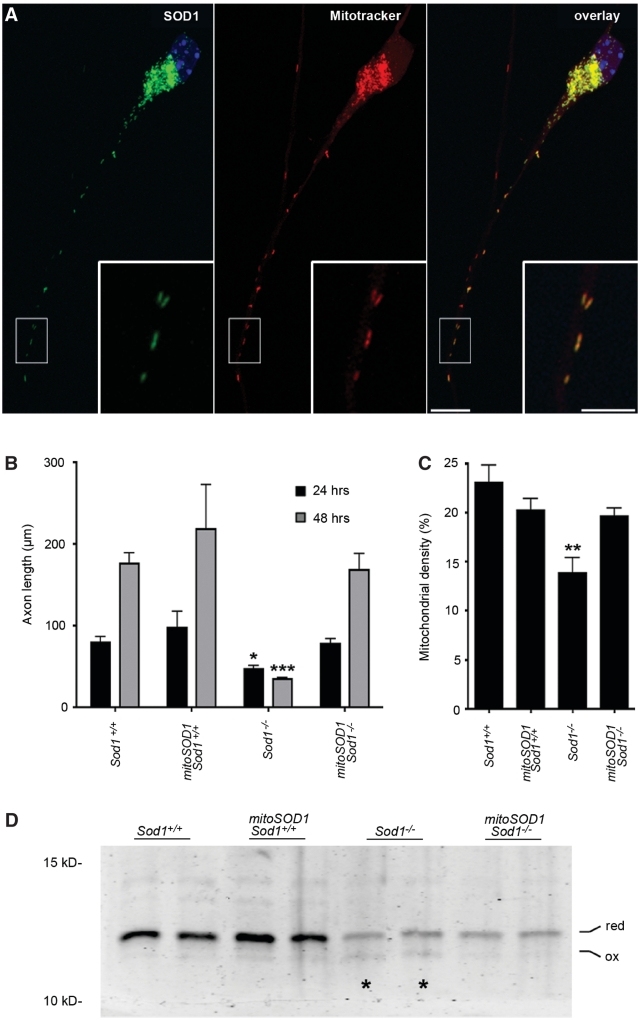
Figure 6.
MitoSOD1 rescues axon outgrowth and normalizes mitochondrial density in Sod1−/− primary motor neurons. (A) Mitochondrial localization of mitoSOD1 was verified by double labelling for human SOD1 (Sigma antibody, in green) and Mitotracker Red CM-H2XRos. A representative mitoSOD1,Sod1−/− motor neuron (24 h) is shown. Scale bar = 10 µm (inset 5 µm). (B) Axon length at 24 and 48 h in culture (24 h: *P < 0.05, Sod1−/− versus all other genotypes; 48 h: ***P < 0.001, Sod1−/− versus all other genotypes; P > 0.05 for all other comparisons; ANOVA with Tukey post hoc test). (C) Mitochondrial density, calculated as the summed length of all mitochondria in the axon, divided by the axon length (**P < 0.01, Sod1−/− versus all other genotypes; ANOVA with Tukey post hoc test). In B and C, mean ± SEM is shown from multiple motor neuron preparations, needed to generate at least n = 3 replicates per genotype. (D) Thioredoxin-2 redox western from cortical neurons (72 h in culture). Oxidation of thioredoxin-2 (asterisks) is attenuated in mitoSOD1,Sod1−/− neurons. Note that protein loading was not equalized between samples (refer to ‘Methods’ section).

