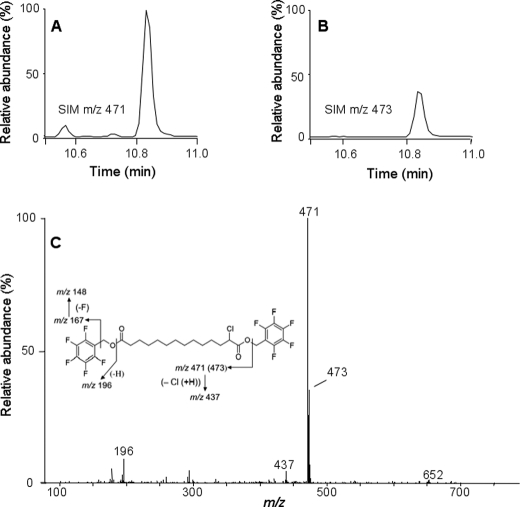
FIGURE 3.
Identification of 2-ClTDDA. HepG2 cells were incubated with 50 μm 2-ClHA for 24 h. At the end of the incubation period, media were extracted, derivatized by PFB-Br, and analyzed by GC-MS in the NICI mode. The mass spectrum of 2-ClTDDA (C) and the chromatograms obtained utilizing SIM of m/z 471 (A) and m/z 473 (B) are shown. A and B, 100% relative abundances were set to equal ion counts.

