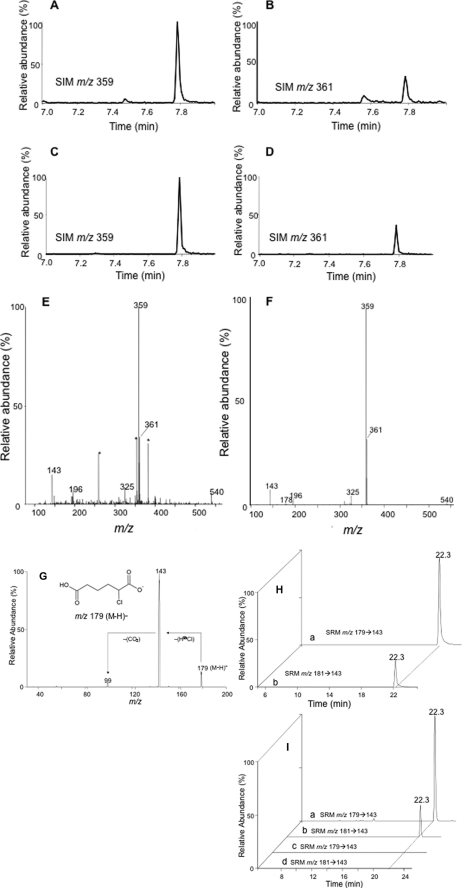
FIGURE 4.
Identification of 2-ClAdA. Media extracts from HepG2 cells incubated with 50 μm 2-ClHA were analyzed for 2-ClAdA by either GC-MS, ESI-MS/MS, or LC-MS/MS as outlined under “Experimental Procedures.” The mass spectrum (E and F) and SIM chromatograms for m/z 359 (A and C) and m/z 361 (B and D) of the di-PFB ester of 2-ClAdA from media extracts (A, B, and E) and synthetic 2-ClAdA (C, D, and F) is shown. Asterisk is used to show peaks not attributed to 2-ClAdA. A and B, 100% relative abundances were set to equal ion counts. Similarly, in C and D, 100% relative abundances were set to equal ion counts. The ESI-MS/MS spectrum of synthetic 2-ClAdA (G) depicting the [M − H]− ion (inset) and the prominent neutral losses (marked by arrows) is also shown. Synthetic 2-ClAdA (H, trace a and b, with each trace with 100% relative abundances set to equal ion counts) and the underivatized media extracts (I, trace a–d, with each trace with 100% relative abundances set to equal ion counts) of HepG2 cells incubated in the presence (trace a and b) and in the absence (trace c and d) of 2-ClHA were also analyzed by LC-MS/MS using SRM 179 → 143 and 181 → 143 as indicated.

