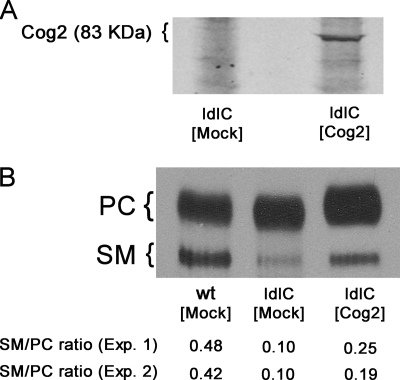
FIGURE 6.
Cog2 cDNA transfection increases SM level of ldlC cells. A, ldlC cells were transfected with Cog2 cDNA, and the expression of Cog2 (83 KDa) was visualized by Western blot using anti-HA monoclonal antibody in both mock-transfected and Cog2-transfected cells, as indicated. B, transfected ldlC cells were cultured overnight in the presence of [3H]palmitate. Radioactive lipids from mock-transfected WT and ldlC cells and from Cog2-transfected ldlC cells (ldlC [Cog2]) were extracted with chloroform:methanol (2:1, by volume), the extract was partitioned, and the lower phase was analyzed by HPTLC as described under “Experimental Procedures.” Chromatograms were exposed to radiographic films, and the percent contribution of the bands was quantified by densitometry using ImageJ software. The SM/PC ratio determined for each cell type in two independent experiments (Exp. 1 and Exp. 2) is indicated at the bottom of the autoradiogram.

