FIGURE 1.
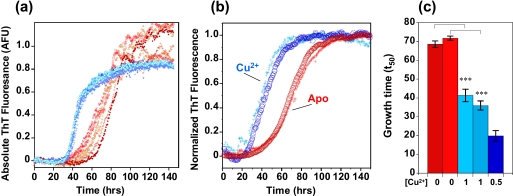
Cu2+ accelerates fiber growth. a, fiber growth curves with 0.5 mol eq Cu2+ (blue traces) and without Cu2+ (red traces) at pH 7.4. Six traces are shown for each condition, and the ThT fluorescence values are absolute. 5 μm Aβ(1–40), 50 mm HEPES buffer, 160 mm NaCl at 30 °C is shown. b, average of nine growth curves recorded on two separate occasions, apo in red, 1 mol eq of Cu2+ in blue. The fluorescence signal is normalized at maximal intensity. c, time to reach half-maximal fluorescence (t50) in two experiments with 0 (red), 1 (mid-blue), or 0.5 (dark blue) mol eq of Cu2+ ions. The presence of Cu2+ typically halves the time taken to form fibers. Error bars are for S.E. from nine traces. ***, p = 0.001.

