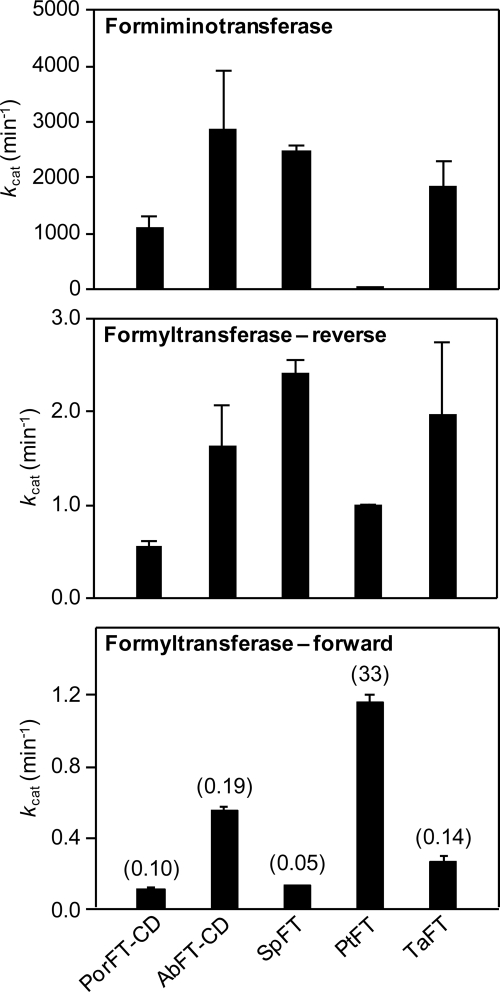
FIGURE 7.
Comparison of kcat values for the formimino- and formyltransferase activities of glutamate formiminotransferases. Data are mean values ± S.E. from three replicates. Top panel, formiminotransferase activity in the physiological direction (FIGLU + THF → glutamate + 5-NH=CH-THF). Middle panel, formyltransferase activity in the reverse direction (N-formylglutamate + THF → glutamate + 5-CHO-THF). Bottom panel, formyltransferase activity in the forward direction (glutamate + 5-CHO-THF → N-formylglutamate + THF); the ratio of each forward kcat to the corresponding formiminotransferase kcat in per mil units (‰) is given in parentheses. Por, porcine; Ab, Acidobacteria bacterium; Sp, S. pyogenes; Pt, P. torridus; Ta, T. acidophilum.

