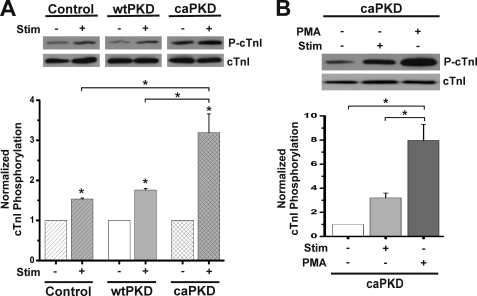
FIGURE 4.
Electrical stimulation of control and caPKD myocytes increases cTnI phosphorylation. Cultured myocytes were subjected to 1-Hz field stimulation or PMA treatment (200 nm, 15 min) as described under “Experimental Procedures.” Cells were rapidly harvested, and protein extracts were analyzed by Western blot analyses. Blots were probed with anti-P-cTnI to detect phosphorylation at Ser22/23 and anti-cTnI to detect total cTnI protein levels. A, representative blot of cTnI phosphorylation before stimulation (−) and after electrical stimulation (+) as indicated. Control, wtPKD, and caPKD samples shown were run and developed on the same gel in separated lanes. The lower histogram shows summary data from multiple preparations of cTnI phosphorylation normalized to cTnI total protein (means ± S.E. (error bars), n = 3). Control, wtPKD, and caPKD values were further normalized to prestimulation levels. B, representative blot of cTnI phosphorylation in caPKD cells before and after electrical stimulation or after PMA treatment as indicated. The lower histogram shows summary data for these experiments (means ± S.E., n = 3) with caPKD values normalized to prestimulation levels. *, statistical significance, p < 0.01 versus prestimulation levels for control, wtPKD, and caPKD or differences as indicated with brackets.

