FIGURE 5.
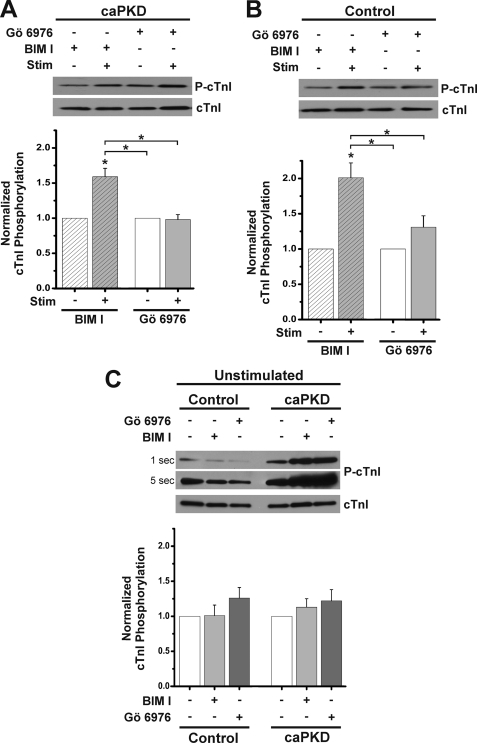
Small molecule PKD inhibitor blocks stimulus-dependent cTnI phosphorylation. Cultured myocytes were treated with 5 μm BIM I or Gö6976 for 45 min prior to electrical stimulation as described in the legend to Fig. 4. Western blots from cell extracts were probed with anti-phospho-cTnI antibody to detect levels of P-cTnI and anti-cTnI to detect total cTnI protein level within each sample. A, upper panel shows a representative blot of cTnI phosphorylation in caPKD cells before and after stimulation in presence of inhibitors as indicated. The histogram below displays summary data with cTnI phosphorylation normalized to total cTnI protein (means ± S.E. (error bars), n = 4). BIM I and Gö 6976 values were further normalized to prestimulation levels. B, representative blot of cTnI phosphorylation in an experiment parallel to that in A except that control myocytes were examined. A summary histogram shows the means ± S.E. (n = 4). BIM I and Gö 6976 values were further normalized to prestimulation levels. *, statistical significance for caPKD or control, p < 0.01 versus prestimulation levels for BIM I or Gö 6976 or differences as indicated with brackets. C, representative blot of cTnI phosphorylation in unstimulated control and caPKD cells in the absence (−) or presence (+) of inhibitor as noted. Samples shown together were run and developed on the same gel. Exposure times for a representative blot are given on the left side of the blot. Summary data are shown below (means ± S.E., n = 4) with control and caPKD values further normalized to unstimulated (without inhibitor) levels.

