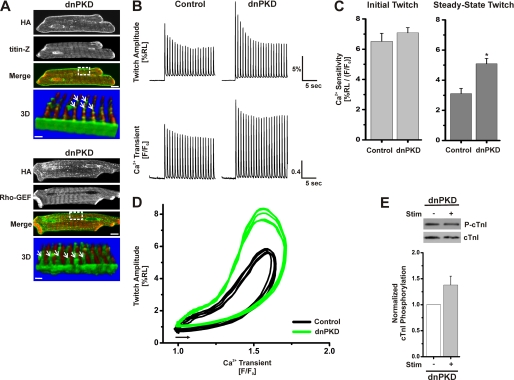
FIGURE 8.
Impact of localized dnPKD expression in cardiac myocytes on myofilament Ca2+ sensitivity and stimulus-dependent changes in cTnI phosphorylation. Myocytes were cultured for 24 h after infection with dnPKD adenovirus as described under “Experimental Procedures” and in the legend to Fig. 2 to express dnPKD at levels comparable with those for caPKD and wtPKD (see supplemental material). A, confocal images of fixed cells prepared for double label immunofluorescent analysis using anti-HA antibody (green) with anti-titin-Z antibody (red) in the upper panel or with anti-obscurin Rho-GEF antibody (red) in the lower panel. Scale bar, 10 μm. The bottom panel (labeled 3D) shows a three-dimensional image constructed from consecutive Z-scans (0.3 μm apart) of the boxed region in the merged image and rotated by about 200° (so that the sarcolemma edge is close to the viewer). Scale bar, 1.5 μm. The white arrows identify HA localization along the Z-line with a punctate, lattice-like/reticular distribution pattern. Control data in B–D are identical to control data presented in Fig. 3 so that direct comparisons of data sets collected on the same day could be made. B, representative traces of cell shortening (twitch amplitude, %RL) and Ca2+ transients (F/F0) measured simultaneously from individual cardiomyocytes treated with control adenovirus or those expressing dnPKD. The upper traces show the change in sarcomere length during 20-s stimulation at 1 Hz. The lower traces display the corresponding change in the [Ca2+]i transient magnitude in these Fluo-3-loaded cells. C, summary data of Ca2+ sensitivity of contraction for control adenovirus and dnPKD myocytes. Data are means ± S.E. from multiple culture preparations, n = 20–40 cells. *, statistical significance, p < 0.05 versus control. D, representative phase-plane plots of instantaneous cell shortening as a function of the Ca2+ transient during five consecutive steady-state twitch contractions for control (black) and dnPKD (green). Phase-plane loops proceed counterclockwise and start from points indicated by the arrow. E, representative blot of cTnI phosphorylation before (−) and after (+) electrical stimulation for dnPKD myocytes. Western blots were probed with anti-phospho-cTnI antibody to detect levels of P-cTnI and anti-cTnI antibody to detect total cTnI protein level within each sample. The histogram below presents summary data of cTnI phosphorylation normalized to cTnI total protein. dnPKD values were further normalized to prestimulation level. Data are means ± S.E. (error bars) from multiple culture preparations, n = 3. Statistical significance, p < 0.01, was achieved in caPKD cells when comparing prestimulation levels with stimulation levels (data not shown) but not in dnPKD cells.

