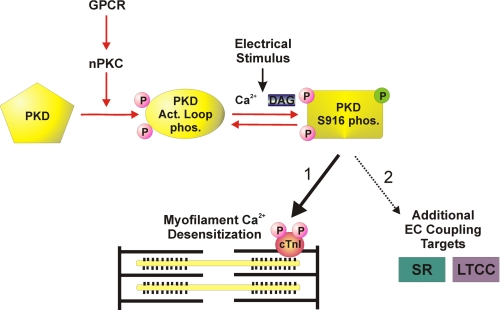
FIGURE 9.
Schematic diagram emphasizing a localized PKD signaling cascade that contributes to the dynamic regulation of Ca2+ sensitivity of contraction in cardiac myocytes. The diagram depicts a multistep model for stimulus-dependent PKD activation, emphasizing an nPKC-dependent pathway to achieve PKD activation loop phosphorylations (oval labeled Act. Loop phos.), which is mimicked by our caPKD construct. An electrical stimulus is required to achieve further activation of this kinase. This step is reversible and most likely reflects the stimulus-dependent autophosphorylation of Ser916 (rectangle labeled PKD S916 phos.) within the catalytic domain of PKD and possibly at other sites within the regulatory domain of PKD (30). Although phosphorylation of Ser916 may or may not be a direct readout of PKD activation state, it is required for the subsequent stimulus-dependent phosphorylation of cTnI at Ser22/23 and development of myofilament Ca2+ desensitization (pathway 1). Pathway 2 demonstrates additional EC coupling targets of PKD signaling that are consistent with the spatial distribution of PKD and functional analyses on sarcoplasmic reticulum (SR) Ca2+ load and L-type calcium channel (LTCC) current (ICa) (11, 12).

