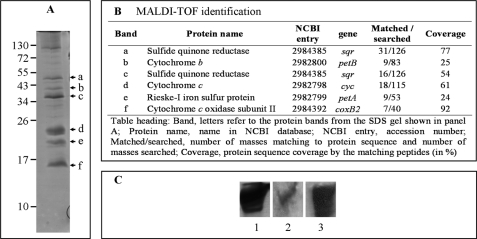
FIGURE 2.
Protein composition of the purified supercomplex. A, separation of the subunits of the supercomplex (25 μg) on a 4–20% SDS gel and staining with Coomassie Blue. Arrowheads indicate subunits identified by mass spectrometry (B). The upper band (>100 kDa), not marked with an arrowhead, was not identified. B, identification of subunits by MALDI-TOF mass spectrometry. C, migration of the supercomplex (30 μg) on a 5–15% Tris-glycine native gel and detection with Coomassie Blue (lane 1), A. ferrooxidans Cox B antibodies (lane 2) for detecting the Aquifex cytochrome c oxidase, and A. aeolicus Sqr antibodies (lane 3).

