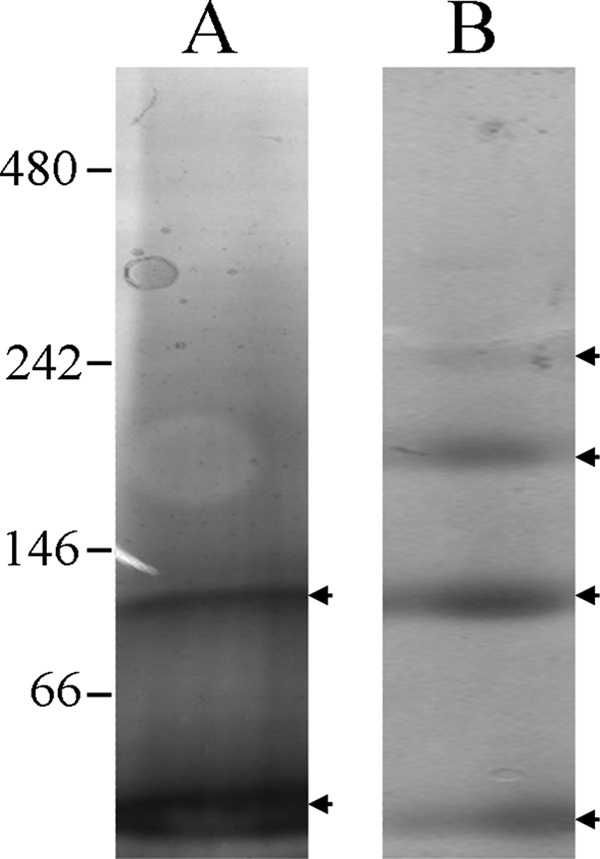
FIGURE 6.

Migration of the purified Sqr on blue native gel. 4–15% gels were used, and 10 μg of Sqr were loaded in all cases and detected by Coomassie Blue staining. A, Sqrreleased. B, Sqrfree. Protein bands are indicated by arrowheads and correspond to the monomer (58 kDa), dimer (106 kDa), trimer (175 kDa), and an higher oligomeric state (240 kDa) of the Sqr. Molecular mass markers are indicated in kDa.
