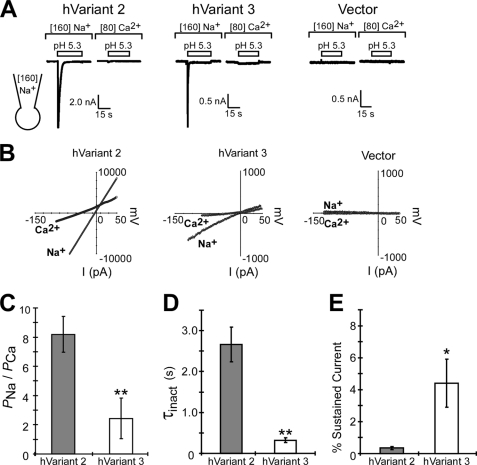
FIGURE 6.
Calcium permeability of ACCN2 transcript variant 3 expressed in CHO cells. A, representative trace of proton-gated currents in CHO cells transfected with hVariant 2, hVariant 3, and vector (pMT3). Recordings were done using whole cell patch clamp with extracellular solutions containing 160 mm NaCl or 80 mm CaCl. Pipette solution contained 160 mm NaCl. B, representative I/V plot of voltage ramp (−100 to +50 mV) applied during the transient (inactivating) phase of pH 5.3-activated current. C, quantification of the average calculated sodium/calcium permeability ratio (PNa/PCa) of acid-activated currents from CHO cells expressing hVariant 2 and hVariant 3 (n = 7–9). D, quantification of the τ of inactivation (τinact) calculated from the decay phase of pH 5.3-activated proton-gated currents from CHO cells transfected with human hVariant2 or -3 in sodium-containing solutions. E, quantification of the sustained phase of pH 5.3-activated currents in CHO cells transfected with hVariants 2 or 3 in sodium-containing solutions. “% Sustained” current was calculated by measuring the residual current 10 s after activation and normalizing it to peak current amplitude. Asterisk indicates a p < 0.05 and double asterisk indicated a p < 0.02 using the Student's t test. Error bars are mean ± S.E.

