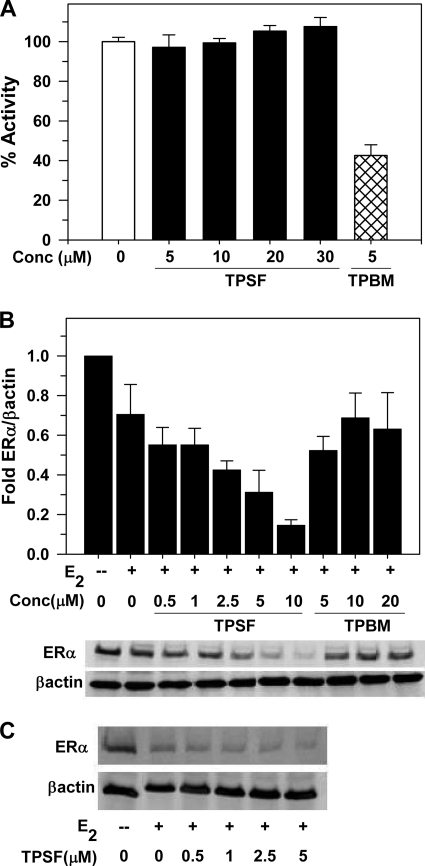
FIGURE 7.
Different modes of action of TPSF and TPBM. A, TPSF does not inhibit binding of E2-ERα to the flcERE. Fluorescence anisotropy microplate assay was performed as described (19) in the presence of increasing concentrations of TPSF (solid bars) and 5 μm TPBM (hatched bar). Consistent with our detailed dose-response study (19), 5 μm TPBM inhibited binding of TPBM to the flcERE by ∼60%. Data were plotted with the change in anisotropy for binding of E2-ERα to the flcERE in the absence of small molecule inhibitors (open bar) set to 100% (actual anisotropy: flcERE, 44 mA units; E2-ERα-flcERE, 81 mA units). Data are the average + S.E. of four experiments. The difference between 5 μm TPSF and the control (no inhibitor) was not significant (p > 0.05). The data for 5 μm TPBM were significantly different from both the control and from 5 μm TPSF (p < 0.01 using Student's t test) B, TPSF decreases ERα levels. MCF-7 cells were cultured in 5% CD calf serum for at least 2 days and maintained in the absence or presence of E2 and the indicated concentrations of TPSF or TPBM for 24 h and analyzed for ERα by Western blot using 8 μg of protein/lane with actin as internal standard. Data are from the Western blot shown and two additional Western blots from independent experiments and are presented as the mean ± S.E. Quantitation of ERα and actin was by PhosphorImager analysis. The value for ERα/actin in the absence of E2 was set equal to 1. C, T47D cells were maintained as described under “Experimental Procedures,” maintained in the absence or presence of E2 and the indicated concentrations of TPSF, harvested, and analyzed by Western blot as described for panel B.

