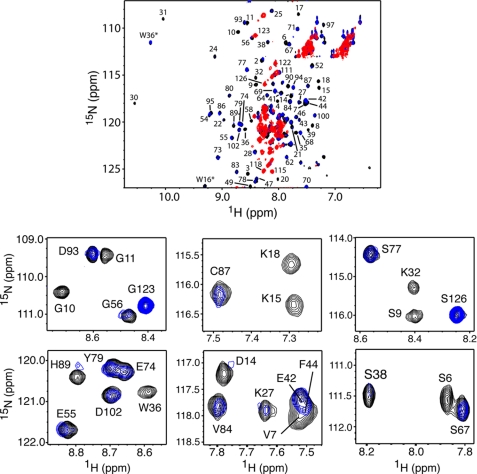
FIGURE 4.
Top panel, overlay of two-dimensional 1H-15N HSQC spectra obtained for a uniformly 15N-labeled myr(+)MA upon titration with unlabeled CaM. Black, myr(+)MA·CaM ratio of 0:1; blue, myr(+)MA·CaM ratio of 0.25:1; red, myr(+)MA·CaM ratio of 1:1. Bottom panel, selected 1H-15N HSQC signals from the top panel are shown to emphasize the significant loss of signal intensity in the N-terminal domain of MA upon CaM binding at 0.25:1 stoichiometry.

