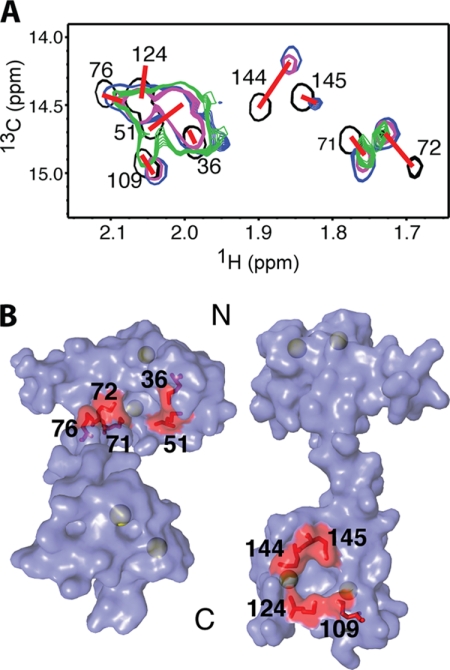
FIGURE 7.
A, overlay of two-dimensional 1H-13C HMQC spectra obtained for 13C-labeled CaM as a function of added unlabeled myr(+)MA. Black, myr(+)MA·CaM ratio of 0:1; blue, myr(+)MA·CaM ratio of 0.25:1; magenta, myr(+)MA·CaM ratio of 0.5:1; green, myr(+)MA·CaM ratio of 1:1. B, surface representation of the CaM structure (Protein Data Base code 3CLN) showing the nine Met residues on the N- and C-terminal lobes (red). Calcium ions are colored in green.

