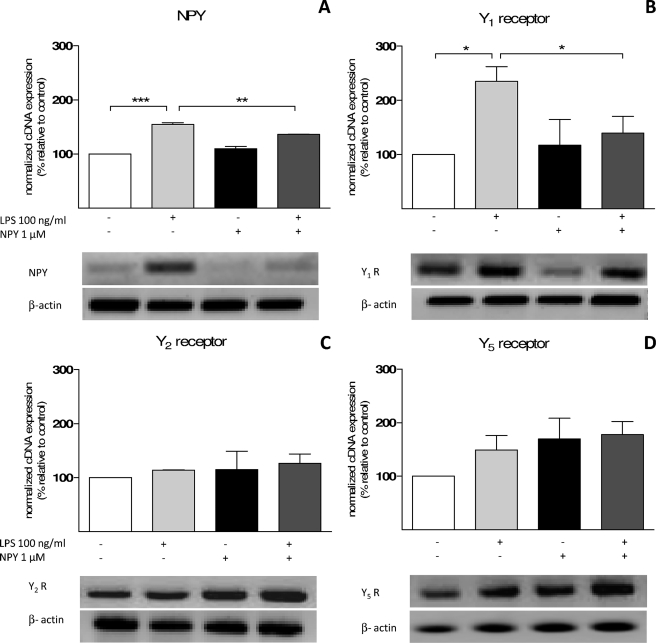
FIGURE 1.
Murine N9 microglial cell line expresses NPY and receptors Y1, Y2, and Y5. Shown is RT-PCR detection of amplified products for NPY (236 bp) (A), Y1R (616 bp) (B), Y2R (318 bp) (C), and Y5R (524 bp) (D). Cells were treated with 1 μm NPY and challenged with 100 ng/ml LPS for 24 h. For semiquantitative analysis, results were normalized to β-actin (428 bp), an endogenous control. LPS-stimulated microglia significantly expressed higher levels of Y1R and NPY cDNA copies. Representative agarose gels for each amplified PCR product are depicted below the respective graph. Data are expressed as mean ± S.E. (error bars) (n = 3) and as a percentage of control (*, p < 0.05; **, p < 0.01; ***, p < 0.001, using Bonferroni's multiple comparison test).

