
FIGURE 2.
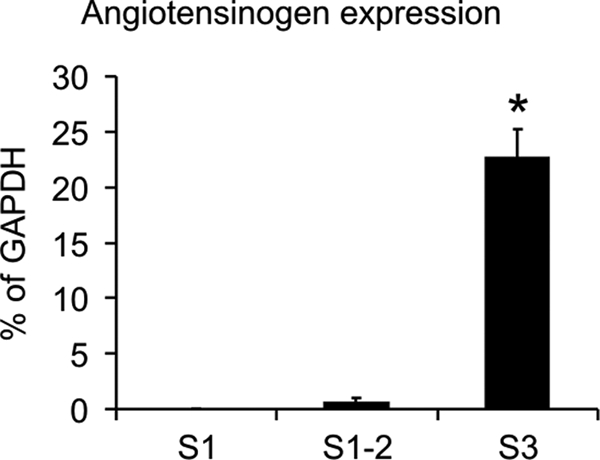
Quantitative RT-PCR analysis of AGT mRNA expression from isolated single-nephron preparations. The percentages of AGT mRNA relative to the respective GAPDH mRNA abundances are shown for proximal S1, S1/S2, and S3 segments. *, p < 0.001.
Official websites use .gov
A
.gov website belongs to an official
government organization in the United States.
Secure .gov websites use HTTPS
A lock (
) or https:// means you've safely
connected to the .gov website. Share sensitive
information only on official, secure websites.
Quantitative RT-PCR analysis of AGT mRNA expression from isolated single-nephron preparations. The percentages of AGT mRNA relative to the respective GAPDH mRNA abundances are shown for proximal S1, S1/S2, and S3 segments. *, p < 0.001.