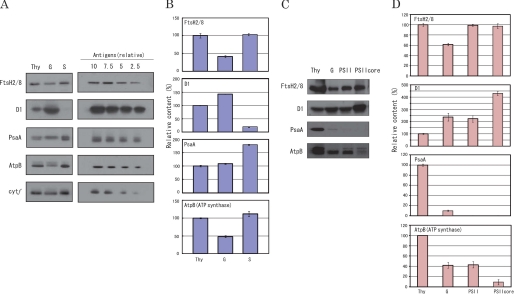
FIGURE 1.
Distribution of FtsH proteases in thylakoids and various membrane fractions derived from the thylakoids. A, Western blot analysis showing the amounts of FtsH2/8 proteases, the D1 protein, PsaA, AtpB, and cyt f in spinach thylakoids (Thy), digitonin/Triton X-100 solubilized grana (G), and stroma thylakoids (S). In the left halves of the gels, the amount of the sample in each lane was adjusted on the basis of cyt f, whereby the band of cyt f (the bottom gel) in each lane showed the same density in the fluorogram. The amounts of the samples were equivalent to 1 μg of chlorophyll for the thylakoids, 5 μg of chlorophyll for the grana, and 0.24 μg of chlorophyll for the stroma thylakoids. In the right halves of the gels, the gradient of each antigen that was used for quantification of the bands in the left half of each gel is shown. B, the relative amounts of FtsH2/8 proteases, the D1 protein, PsaA, and AtpB in thylakoids (Thy), grana (G), and stroma thylakoids (S). The amount of each protein was measured using Scion Image software. C, Western blot analysis showing the amounts of FtsH2/8 proteases, the D1 protein, PsaA, and AtpB in thylakoids (Thy), grana (G), Triton X-100 solubilized PSII membranes (PSII) and PSII core complexes (PSII core). D, the relative amounts of FtsH2/8, the D1 protein, PsaA, and AtpB in each membrane sample. The membrane samples were subjected to SDS/urea-PAGE and subsequently to Western blot analysis with the antibodies against VAR2 from A. thaliana FtsH2, the C terminus of the D1 protein, PsaA, AtpB, and cyt f. The data are the means of three independent measurements ± S.D.

