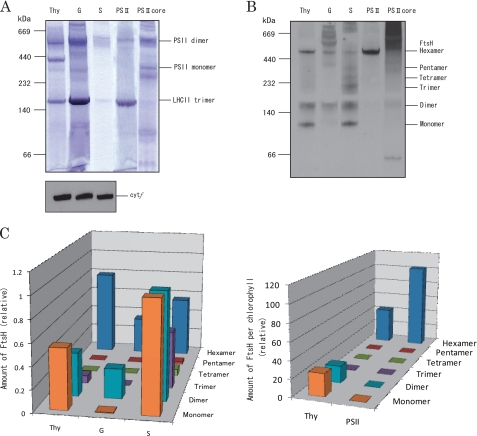
FIGURE 2.
Composition and distribution of FtsH proteases revealed by CN-PAGE and Western blot analysis. A, CN-PAGE of thylakoids (Thy), grana (G), stroma thylakoids (S), PSII membranes (PSII), and PSII core complexes (PSII core). The protein complexes were stained by Coomassie Brilliant Blue. Molecular markers are shown on the left-hand side of the gel, and the positions of PSII dimer, monomer, and LHCII trimer are indicated on the right-hand side of the gel. The amounts of membrane samples loaded were the same as those described in Fig. 1A. After this adjustment, the amounts of the proteins in the lanes of Thy, G, and S become comparable with each other on the basis of cyt f. At the bottom, the amount of cyt f in each lane is shown by Western blot analysis. The amounts of proteins in Thy, PSII, and PSII core lanes were comparable with each other on the basis of chlorophyll. B, Western blot analysis with anti-VAR2 antibody showing monomers and oligomers of FtsH in the same gel as that used in A. The molecular markers are shown on the left-hand side of the gel, and the sizes of the FtsH monomer and oligomers are shown on the right-hand side of the gel. C, quantification of the FtsH monomers and oligomers in thylakoids and the membranes fractions on the basis of cyt f (left) and chlorophyll (right). The data are the means ± S.D. (n = 3).

