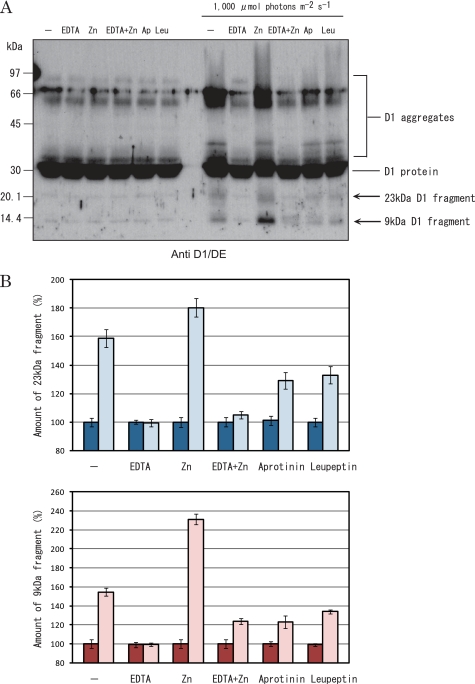
FIGURE 4.
Effects of various protease inhibitors on degradation of the D1 protein under excessive illumination. A, a typical fluorogram of Western blot analysis showing the D1 protein of the PSII membranes. The samples were either dark incubated (left half of the gel) or illuminated with strong light with an intensity of 1,000 μmol of photons m−2 s−1 for 60 min (right half of the gel) at 20 °C in the presence and absence of various protease inhibitors and/or ZnCl2 (0.15 mm) and subsequently subjected to SDS/urea-PAGE and Western blot analysis. The antibody against the DE loop of the D1 protein was used. At the top of the gel, Ap and Leu represent aprotinin and leupeptin, respectively. EDTA, aprotinin, and leupeptin were used at the concentrations of 1 mm, 5 μm, and 5 μm, respectively. Each lane contains PSII membranes equivalent to 2.5 μg of chlorophyll. B, the amounts of 23-kDa (top) and 9-kDa (bottom) fragments of the D1 protein. The data are derived from the Western blot analysis in A. The bars with strong color represent dark controls, and the bars with weak color represent the D1 fragments produced under strong illumination.

