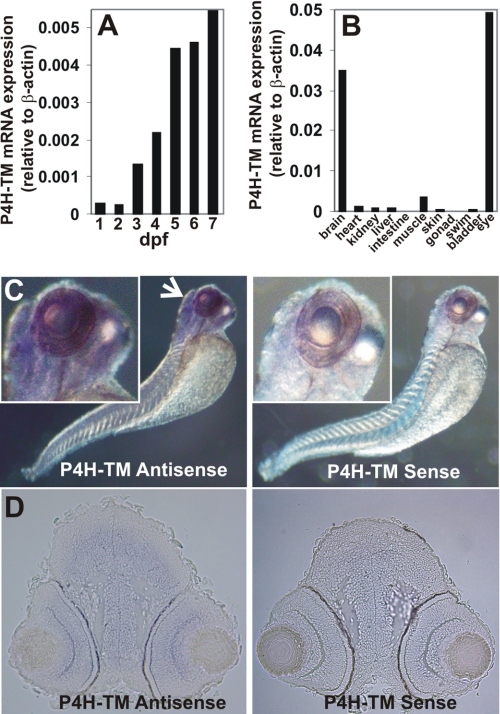
FIGURE 1.
Analysis of P4H-TM expression in zebrafish. A, Q-PCR analysis of P4H-TM mRNA expression in 1–7-dpf embryos (B) and various female adult tissues relative to β-actin. Each bar represents a value for a pool of 50 embryos (A) or for two adults (B). C, whole mount in situ hybridization analysis of P4H-TM expression with an antisense and sense (negative control) probe in 3-dpf larva. The arrow indicates intense staining in the head and eye. D, cryosections of the head of the 3-dpf larva show P4H-TM expression in telencephalon and diencephalon and in retina.

