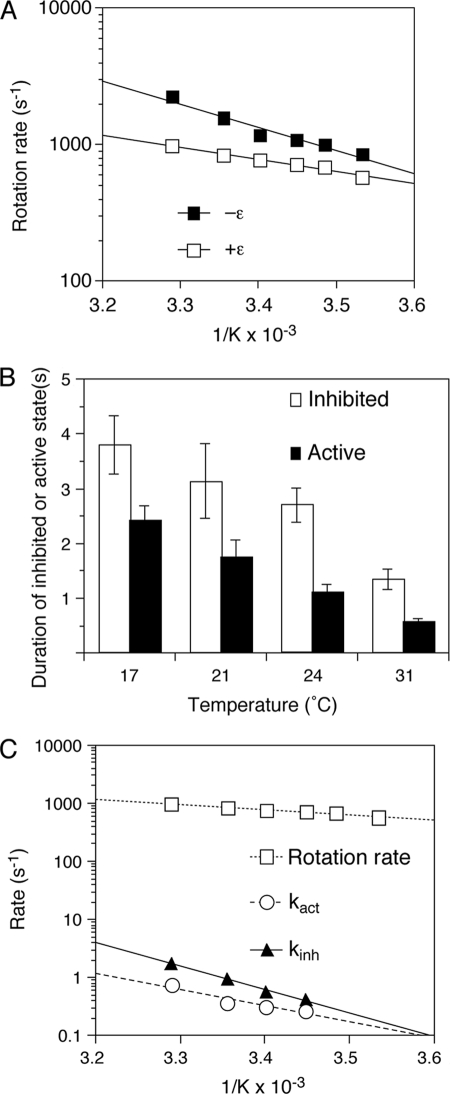
FIGURE 6.
Transition state thermodynamic analyses of rotation and the inhibited state in the presence of the ϵ subunit. A, Arrhenius plots of γ subunit rotation in the absence or presence of excess ϵ subunit. Rotation of 60-nm gold beads was followed for 2 s, and rotation rates were obtained from the reciprocals of the geometric means of the single revolution times (time required for a 360° revolution) (18). Plots of rotation rates without (■) and with (□) the ϵ subunit are shown. B, effect of temperature on the inhibited and active states of γ subunit rotation in the presence of excess ϵ subunit. Rotation of F1 in the presence of 100 nm ϵ subunit was followed for 32 or 64 s at different temperatures. The duration times of the active and inhibited states are shown with S.E. C, Arrhenius plots of kact (○) and kinh (▴) in the presence of excess ϵ subunit are plotted with the rotation rate of F1 also in the presence of excess ϵ subunit (□).

