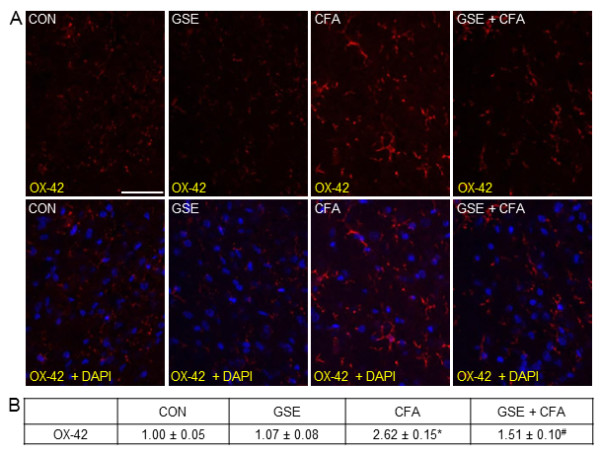
Figure 7.

GSE treatment represses CFA stimulated OX-42 expression in microglia. Sections of spinal cord were obtained from untreated animals (CON), GSE treated animals (GSE), animals injected with CFA (CFA), or animals pretreated with GSE prior to an injection of CFA (GSE + CFA). (A) Images of spinal cord sections stained for OX-42 are shown in the top panels. The bottom panels represent the same sections co-stained with OX-42 and DAPI. (B) The average fold change ± SEM of OX-42 staining intensity from control values is reported (n = 3 independent experiments) * P < 0.01 when compared to control levels, while # P < 0.01 compared to CFA stimulation. Magnification bar = 50 μm.
