
Figure 3.
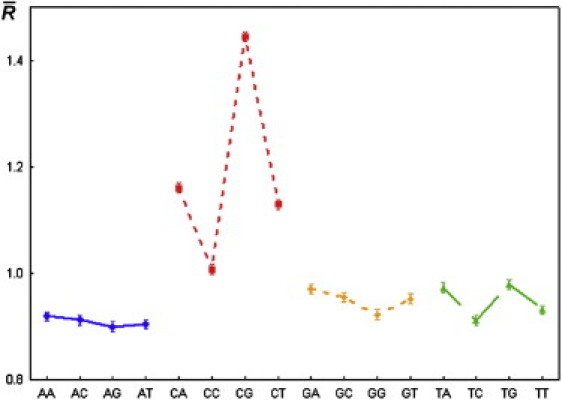
Mean values of the relative intensity of cleavage (cleavage rates) for all dinucleotides, and 95% confidence limits for the population mean. Symbols: ■, ▴, ⋄, ○–mean value; I 95% confidence limits for the population mean.
Official websites use .gov
A
.gov website belongs to an official
government organization in the United States.
Secure .gov websites use HTTPS
A lock (
) or https:// means you've safely
connected to the .gov website. Share sensitive
information only on official, secure websites.
Mean values of the relative intensity of cleavage (cleavage rates) for all dinucleotides, and 95% confidence limits for the population mean. Symbols: ■, ▴, ⋄, ○–mean value; I 95% confidence limits for the population mean.