
Figure 6.
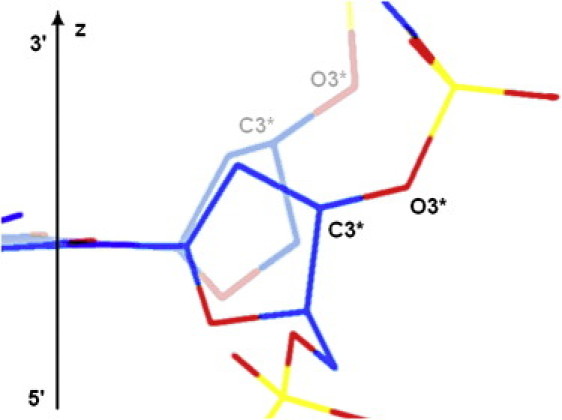
Schematic representation of a possible change in the C3′-O3′ bond alignment during S↔N interconversion of deoxyribose in B-DNA. The fragment of the sugar-phosphate backbone with the N-state of deoxyribose is shown faded, and that with the S-state is bright. The angle between the DNA helical axis (shown as vertical z axis) and the direction of the C3′-O3′ bond is lower in the N-state than in the S-state.