
Figure 4.
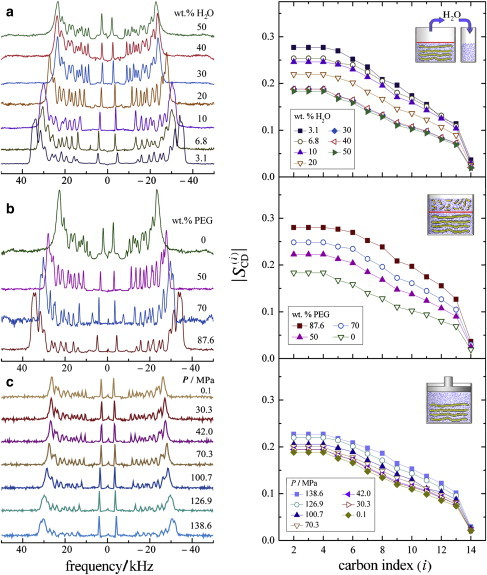
Comparison of bilayer structural changes as revealed by solid-state 2H NMR for three different methods of applying external pressure (see Fig. 1, a−c). Solid-state 2H NMR spectra (left) and corresponding C−2H bond segmental order profiles (right) are shown as a function of segment index (i) for DMPC-d54 bilayers in the liquid-crystalline (Lα) state at T = 45°C. (a) 2H NMR spectra and order profiles showing bilayer deformation induced by increased dehydration pressure (gravimetric dehydration). (b) 2H NMR spectra and order profiles as a function of osmotic pressure due to the presence of PEG 1500. (c) 2H NMR spectra and order profiles obtained at different bulk hydrostatic pressures (data from Brown et al. (47) with permission of the American Physical Society). Note that a larger change in segmental order profiles is seen with application of dehydration or osmotic pressure than for hydrostatic pressure.