
Figure 4.
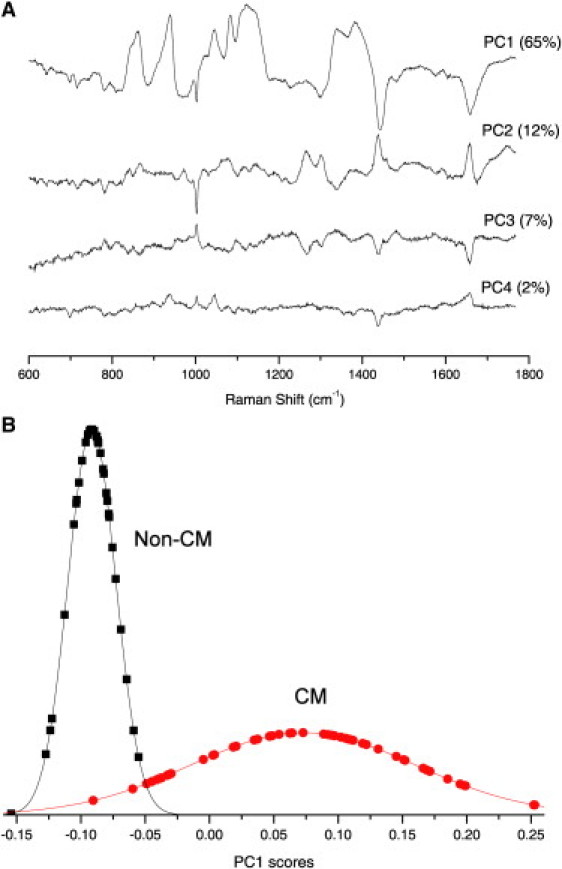
(A) First four PC loading spectra in the PCA of Raman spectra of CMs and non-CMs. The variance captured by each PC is shown in brackets. (B) Distribution of the scores corresponding to the first PC (PC1) for CMs (circles) and non-CMs (squares).