
Figure 4.
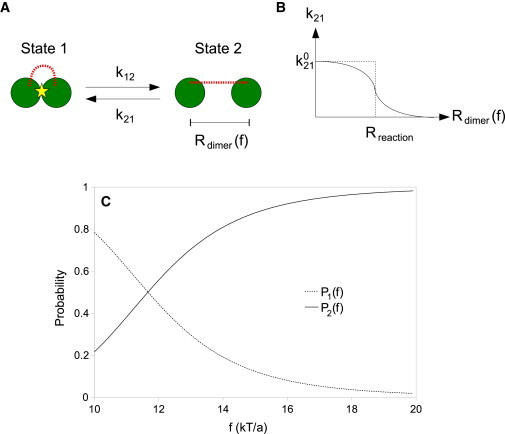
(A) Schematic of the two states of the dimer. (B) Distance dependence of the rate constant from state 2 to state 1. (Note that the solid line is the approximate function used in deriving the kinetic theory, and the dotted line is the step function used in stochastic simulations.) (C) Trends of the force dependence of the probabilities for the dimer to be in state 1 (P1 (f)) and state 2 (P2 (f)).