
Figure 7.
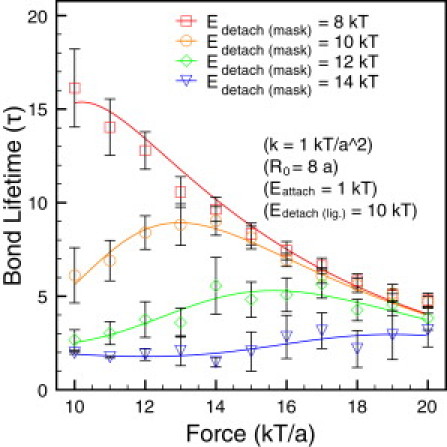
Force dependence of the bond lifetime when changing the energy barrier for detaching the masking domain. The different barriers are shown in the figure. (Symbols are from stochastic simulations, and solid lines are the corresponding curves from the kinetic theory. The simulation parameters used here are: k = 1 kT/a2, R0 = 8a, Eattach = 1 kT, Edetach(lig.) = 10 kT, and Edetach(mask) = 8 ∼ 10 kT.)