
Figure 8.
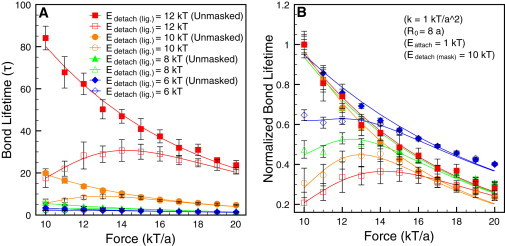
(A) Force dependence of the bond lifetime when changing the energy barrier for detaching the ligand. (B) For clarity, the data in panel A is normalized by dividing by the maximum bond lifetime from the unmasked case. (Symbols are from stochastic simulations, and solid lines are the corresponding curves from the kinetic theory. The simulation parameters used here are: k = 1 kT/a2, R0 = 8a, Eattach = 1 kT, Edetach(lig.) = 6 ∼ 12 kT, and Edetach(mask) = 10 kT.)